In Questions, I want to pose questions every week, to frame my week around exploring answers to those questions.
In the spirit of scene-making, I’m offering a 150k IDR bounty (~10 USD - i know, but it’s ~40 USD-int) for anyone who answers any one of these questions publicly (be it in a Twitter thread, or a long-form post, etc.)
This week’s 2025w11 theme is on some policy-relevant questions around Indonesia.
Before we start, here’s a cute dog. We love cute animals around here 😤.

Q1 - Is there a risk-premium that investors take when investing in SOEs vs private-sector firms? If so, by how much? How much larger particularly in Indonesia?
- A quite illustrative example is that on IDX, BBCA (the largest Indonesian private bank) has a market cap that’s similar to the market caps of the 4 big state-owned banks (BBRI, BMRI, BBNI, BBTN - collectively known as Himbara) combined.
- which feels nuts at first? The Himbara banks feel totally dominant on the market.
∗
- Particularly relevant as Danantara - a new, much larger SWF - is being formed by Prabowo.
- My gut says the answer is yes, due to the obvious concerns about political interference in corporate governance, and the explicitly-stated non-profit-making goals of SOEs (Pasal 2 Undang-Undang BUMN). What makes Danantara different is that you’re essentially making these SOEs tightly linked under one management, with even more highly-correlated risks, creating fewer critical points of failure (bus factor).
- Perhaps some comparative examples are in order: How did it go with Singapore’s Temasek and Malaysia’s Khazanah?
- Relevant Manifold Market questions:
∗
- Another interesting question on Danantara: Danantara is formed through UU No. 1 2025 (amendments to the original UU No. 19 2003 on SOEs). But the article only mentions vaguely a Badan Pengelola Investasi (though explicitly named as Daya Anagata Nusantara) with some pretty specific constraints on what they will be required to do.
- The question is that with these constraints, what are some possible ways that Danantara could look like, ie. what does the possible solution-space of Danantara look like? which are taut and slack constraints?
- Guntur mentioned in passing in a convo that the specific form of legal body for this Badan is not-specified. So it might be totally possible to have Danantara as a partnership (Firma) or CV.
∗
- Some meta commentary: the Indonesian legal community needs to find a better way of doing amendments than the constant amendments on top of amendments. Please just amend in full & reenact the specific statutes!
Q2 - What’s the economic impact of Indonesia’s cabotage laws?
- The US has a version of this law - Jones Act - that’s seen a growing resistance as it makes domestic shipping much more expensive vs a comparable international shipping arrangement, essentially due to protection.
- As I understand it, Jones Act is much more restrictive in its form, requiring all domestic shipping to be performed by US-built, US-owned, US-flagged, and US-crewed vessels.
∗
- I’m not familiar with how this restriction on cabotage is implemented in Indonesia. It seems like until recently, no practical restrictions for foreign ships for cabotage were put in place in 2005.
- The relevant authorities seem to refer to the restriction as part of “implementing the cabotage principle”, which is vague. The relevant legal framework is first promulgated through an SBY-era presidential instruction in 2005, which was then translated into law through UU 17 2008 on Shipping.
- I think the fact that it had not been truly enforced until 2005 is because of the successful lobbying by the then quite powerful export-oriented lobby in Indonesia, though on this I’m not quite sure. This was apparent in the 1985 presidential instruction that allowed all foreign merchant ships to call at a larger number of ports than previously was possible before.
- H. Hill notes on The Indonesian Economy (pp. 117) “For the first time in the country’s history an export lobby emerged in manufacturing industry, a group for which an internationally efficient economy was of more concern than the dispensation of licences and other bureaucratic largesse.”
- There was also the story of the failed nationalization of the Dutch-owned KPM (Koninklijke Paketvaart Maatschappij, Royal Packet Company) that had a virtual monopoly on inter-islands cargo and passenger shipping during the 1950s, which Indonesia tried to challenge by forming Pelni (Pelayaran Nasional Indonesia).
- A potentially useful research on how Pelni (and other ASEAN Countries’ National Shipping Lines) fared in the 1980s.
- Before the Djuanda Declaration, the prevailing jurisprudence was the ‘cannon-shot rule’, ie. states only have jurisdictions on waters that their cannons can reach (which was taken to be three nautical miles from coast). In the case of Indonesia, this was regulated by the 1939 Ordinance on Territorial Waters and Maritime Zones. This means that a significant part of the waters between the islands of Indonesia was taken to be part of the High Seas with freedom of navigation for all.
- Apparently the government is also implementing what it calls a “Beyond Cabotage” regime, where it also limits some export/import commodities (particularly coal and CPO) to only be carried by national shipping companies.
- Truly amazing the amount of protectionism in display here. I just can’t.
- Apparently Japan, ICS (International Chamber of Shipping) protested the implementation, citing Indonesia’s commitment under WTO’s GATS (pp. 44-45, Pushing the borders on cabotage, Anita, K. D.)
- The relevant authorities seem to refer to the restriction as part of “implementing the cabotage principle”, which is vague. The relevant legal framework is first promulgated through an SBY-era presidential instruction in 2005, which was then translated into law through UU 17 2008 on Shipping.
∗
- Does this affect how companies ship their product between two domestic ports, e.g. by going through a well-established hub like Singapore first to avoid cabotage restrictions?
- How do we quantify the impact? What percentage of shipping costs are actually attributable to the restrictions?
- One way to measure this is to see the cost differentials between domestic and international shipping for ~comparable routes.
- How does it go with Singapore, Malaysia, the Philippines? How did it go with other similar island nations?
- What specific industries are most harmed by this restrictions?
- How should we think about national security and integration considerations in this case?
∗
- Interesting theses which I got no time to read (lmao):
- Indonesian Interisland Shipping: An Assessment of the Relationship of Government Policies and Quality of Shipping Services - Tommy Hendra Purwaka (University of Hawaii, 1989). Advised by Joseph R. Morgan, Department of Geography and Environment.
- The Potential Impact of Indonesian Beyond Cabotage Policy on Coal and Crude Palm Oil Trade - Mochammad Grizhaldo Azranda (Erasmus University Rotterdam, 2019)
- Maritime Administration in Indonesia - Batara Mangarimpun Dharma Uli Manullang (World Maritime University, 1987)
Q3 - Apparently Indonesia’s internal migration rate is one of the lowest in the world, why is this the case?
- From this Bell & Charles-Edwards (2013) UN Technical Paper, “The results of the Courgeau k analysis help clarify the patterns and trends of individual intensities measured at different levels of geographical subdivision. Australia, Malaysia and the United States of America emerge as the most mobile countries in the 1990 round of censuses, and China, Indonesia and Portugal as the least mobile. In the 2000 round of censuses, Australia is again amongst the most mobile countries along with South Africa and Chile, while Indonesia, Honduras and the Philippines are the least mobile.”
- Courgeau k analysis - from Courgeau (1973) - is this very interesting statistical technique that demographers have developed from the fact that you have this difficult problem with comparing migration between countries, as they have different definitions of administrative divisions and some may be larger than the other. They essentially solved this by hypothesizing some kind of log-linear relationship between “Crude Migration Intensity” and the number of regions , which they later (Courgeau, Muhidin, & Bell (2012)) modified with with n being number of regions, and H number of households, which have this nicer interpretation of as H/n → 1, you have this interpretation that the number of CMI should equal w.
- Is this just an artefact of the 1997 Economic Crisis?
∗
- Bell later has this paper in Bell et al. (2015) Internal Migration and Development: Comparing Migration Intensities Around the World, which seems to show Indonesia’s ACMI (Aggregate Crude Migration Intensity) to be much more similar to its neighbors, like Thailand, Vietnam, China, so this might be a nothing-burger after all?
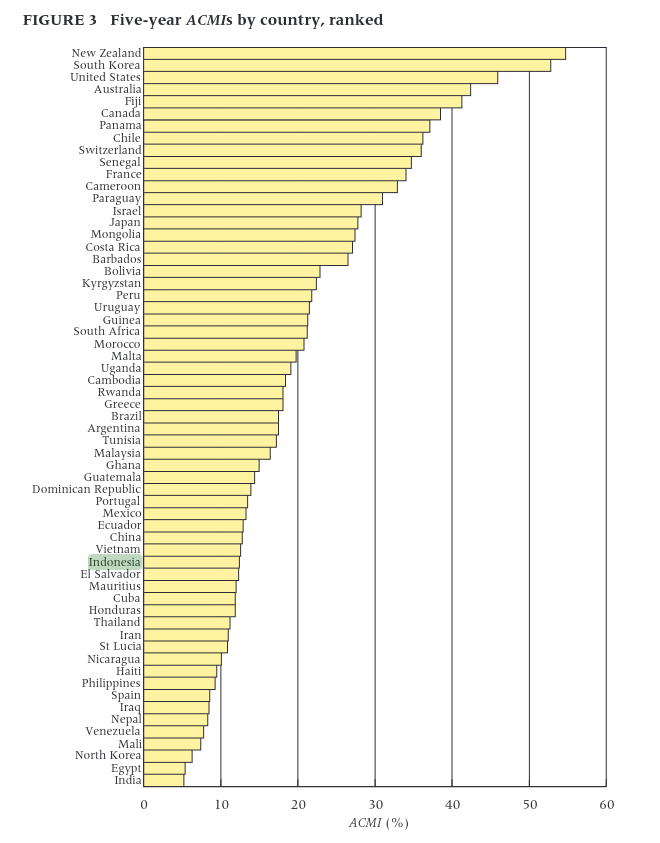
- ” In much of Asia, on the other hand, intensities are generally low, and this is especially marked in South and Southeast Asia, where five-year intensities range from just 5 percent (India) to around 12 percent (Indonesia and Vietnam), with highs of 17–18 percent in Cambodia and Malaysia. South Korea stands out as the high-mobility outlier, followed by Japan, Israel, Mongolia, and Kyrgyzstan.”
∗
- Anyway, I want to appreciate this cool paper by Pardede et al. (2020) Internal Migration in Indonesia: New Insights from Longitudinal Data.
- She takes in this data from five waves of the longitudinal Indonesia Family Life Survey (1993, 1997, 2000, 2007, 2014) - and used a multinomial logit model to estimate the odds ratios of different factors affecting internal migration across three spatial scales (inter-kecamatan, inter-kabupaten, and inter-provincial migration.
- What makes this study particularly valuable is that it measures characteristics BEFORE migration occurs, unlike most studies which can only capture post-migration characteristics. This temporal ordering helps establish causality much better.
- They found out that some results are as expected, i.e. younger persons are more likely to migrate than older ones, more educated ones are more likely to migrate. But also there are some stranger findings, females are apparently more likely to migrate, particularly when they’re the heads of households?
- Also migration from urban areas are higher than migration from rural areas? I thought Indonesia’s going through increasing rates of urbanization? So the explanation is that while the country is indeed urbanizing overall, the higher rate of urban-originating migration suggests Indonesia may have reached what mobility transition theorists call a “later stage” of development—where rural-to-urban flows no longer dominate migration patterns. Instead, we see more complex patterns including significant urban-to-urban migration, which is typically associated with more developed economies.
- The data also reveals strong geographical differences—Sumatra consistently shows higher migration probabilities than Java for shorter-distance moves, while Java residents engage more in long-distance inter-provincial migration from urban centers. This geographical heterogeneity likely reflects differential development patterns and connectivity between Indonesia’s major islands?
- I love multinomial logit—it’s such a cool way of estimating factors when you have categorical outcomes with multiple levels. Instead of just “migrate/don’t migrate” binary outcomes, this approach allows for analyzing the likelihood of migration at different spatial scales simultaneously while controlling for the same set of individual and household characteristics. The model essentially computes relative risk ratios (or odds ratios) for each type of migration compared to staying put
- Also IFLS is so cool!! Thanks RAND Corporation!! 🫡🫡🫡🫡
∗
- Also there’s this funny result from Farre & Fasani (2013) Media exposure and internal migration - Evidence from Indonesia.
- Their key findings is that increased exposure to private television channels actually reduced internal migration rates in Indonesia, which is very counter-intuitive when you think of access to more information as a force that breaks down barriers and as a pull factor that makes people more likely to migrate.
- They’re suggesting that people were over-estimating the net benefits of migration, due to the fact that before the proliferation of private TV channels, Indonesians relied on state-controlled media which likely presented an overly-optimistic view of opportunities elsewhere in the country, particularly in Java. So private television gave people a more accurate view of their relative position in society and the actual positions of other places in Indonesia.
- Mind you the effect size is pretty sizable, the baseline overall migration rate is 30.3% (std. dev. 46%), and the long-term reduction is 3.9-6.8 percent (8-15% of std. dev.).
- A natural question to further ask - which Guntur raised in discussion with me - Is TV access just a proxy for proximity to developed areas? If so, the apparent negative relationship between TV exposure and migration might be confounded.
- The study solves this by adding a “free-space signal strength” (signal strength without topological obstacles) as a control for distance to nearest TV transmitter, with a “predicted signal strength” which measure the actual signal taking into account topography and isolates the actual effect of TV reception to migration.
- Also by using TV reception, and not TV ownership or time spent watching TV, they overcome concerns about wealthier households being more likely to have TVs and therefore less likely to migrate.
∗
- Okay, last paper review. Bryan & Morten (2018) The Aggregate Productivity Effects of Internal Migration: Evidence from Indonesia. I haven’t read this in full remember I’m just a Guy on The Internet.
-
They’re asking how much does productivity increase if we remove barriers to internal migration, accounting for both worker selection and spatial differences in human capital.
-
They focus on two barriers to optimal worker allocation: “movement costs” (direct costs of relocating) and “amenity differences” (quality-of-life differences that require wage compensation).
-
Movement costs in Indonesia are ~39% of income (vs 15% in the us) - this means Indonesians need wages ~39% higher to be willing to move from their birthplace.
-
they find modest but meaningful aggregate gains: a 22% increase in labor productivity from removing ALL barriers, and a 7.1% boost from reducing costs to us levels.
-
Their most striking contribution is showing that migration barriers reduce productivity through TWO channels: 1) preventing workers from sorting to where they have comparative advantage, and 2) preventing sufficient agglomeration in high-productivity locations.
-
tbh I need to understand their model more, I haven’t really grokked it all that well.
-
∗
Okay, more natural questions.
- Assuming that wage-differentials between regions would push the rate of migration, why is Indonesia’s internal migration rate so low? is it just the high movement costs or something deeper like ethnic ties or local social capital that’s hard to rebuild?
- The particularly striking question: what are the spatial mismatch implications of low internal migration? If labor isn’t moving to where jobs are created, how does this affect regional inequality and economic efficiency? How much GDP is Indonesia “leaving on the table” due to these frictions?
- Dana Desa policy is fascinating - does it unintentionally reduce internal migration by improving rural amenities? or might it incentivize the administrative splitting of villages to capture more funds? the fragmentation of local governance units seems relevant to internal migration patterns.
- Kompas.id is doing a series on A Decade of Dana Desa. I haven’t read them lmao.
- Apparently the amount of Desa through the past decade haven’t moved all that much? This suggests that the elasticity of Desa w.r.t Dana Desa is pretty low? I’m kinda surprised by this.
- Could linguistic barriers be playing a role? While bahasa Indonesia is the national language, how much does proficiency vary across islands and rural-urban divides? Do we see differential migration patterns among regions with more similar local languages?
- Is there a digital divide component? As remote work becomes more feasible, does unequal access to digital infrastructure create new migration patterns (or non-migration patterns) that reshape geographical opportunity?
- What about transnational migration within ASEAN? With the asean economic community supposedly facilitating labor mobility since 2015, has this created meaningful migration flows? I’ve heard about Indonesian tech workers in Singapore, Malaysian talent in Bangkok, and even specialized enclaves like the “judi online” operations in Cambodia staffed by Indonesians and Malaysians. none of this seems well-quantified though!
∗
- I’m kinda blown away by how sophisticated Indonesia’s demographic research scene is! between RAND’s IFLS panel data, the intercensal surveys, and the multilevel analytical approaches used by Pardede and others - it’s incredible how much high-quality demographic work is happening. BPS data quality seems to be way better than i expected, and the collaboration between Indonesian researchers and international partners like RAND has produced some pretty cool longitudinal datasets.
Okay, I think that’s enough for our first Questions post. See ya next-week!